This update brings some new features and performance enhancements:
'Repeated correlation'
I added the option 'repeated correlation'. I got the idea while I was working with another software (PIVview). 'Repeated correlation' can enhance your data yield when you are working with very noisy or generally bad PIV images. It does the cross-correlation not only once per vector, but 5 times in total. Each time, it slightly shifts the interrogation windows (the distance depends on the size of your interrogation area, but it's about 5-10 pixels). This happens during each pass in a multipass analysis. In the end, it multiplies the 5 resulting matrices, which results in less noise an a very clear peak. But it also takes about 3 times longer to calculate...
 |
| You'll find this option in the PIV settings. |
 |
| Problematic PIV data without 'Repeated correlation' |
 |
| Problematic PIV data with 'Repeated correlation' turned on. The data yield increases. |
Background elimination
The next big addition is the background elimination GUI. If you have recorded a longer time series of image data, it makes sometimes sense to calculate the average of all images, and subtract it from each image before analysis. I added an extra GUI for this task. You can run it by launching 'Background_GUI.m', or clicking the button in the image pre-processing tab. You can have the same background for all images, or generate a seperate background for image_A and image_B.
 |
| The 'Background GUI' can be accessed from the image pre-processing tab |
 |
| This is how the background GUI looks like |
Disable auto-correlation
Again, I got the idea for this option when I was working with PIVview: Sometimes, background subtraction is not enough. It might still be the case, that your signal is so weak, that the background signal dominates. Usually, the analysis will then lock on the background, reporting zero displacement. When you choose the option 'disable auto-correlation', then each correlation matrix will be masked in the center, disallowing near-zero displacement. The algorithm will then look for the second highest peak which is (hopefully) the desired signal.
 |
| This option can be found in the PIV settings |
 |
| There are two signals overlaying in this PIV image: Some particles are moving in a circle, and some are not moving at all. The analysis looks bad, because the algorithm doesn't know which signal to take.... |
 |
| ... until you tell PIVlab to disable auto-correlation, which will ignore particle shifts close to zero. |
Better 16-bit handling
PIVlab had some problems working with 16-bit image data, this should be fixed now. Additionally, you can now adjust the histogram of your 16-bit image prior to analysis (note that the analysis still uses 8-bit data, your 16-bit images will be converted):
 |
| The histogram of some images isn't optimal for display or analysis. This image is too dark with not enough contrast. |
 |
| With the new 'Auto contrast stretch' feature, the contrast is enhanced for the analysis. This is very important for working with 16-bit images. It is therefore turned on by default. |
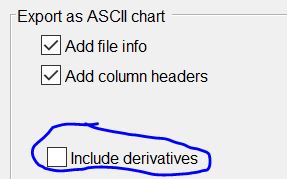
All derivatives available in exported files
When you export an ASCII or Matlab file from PIVlab, you will finally have all the derivatives available in the exported files:


